Malan's summer studio 2020: IoT Product Development from a Data Perspective.


This blog is created to share my learning experience and showcase my portfolio over this 6 week summer studio. I will upload a post by the end of each week. Enjoy my blog!
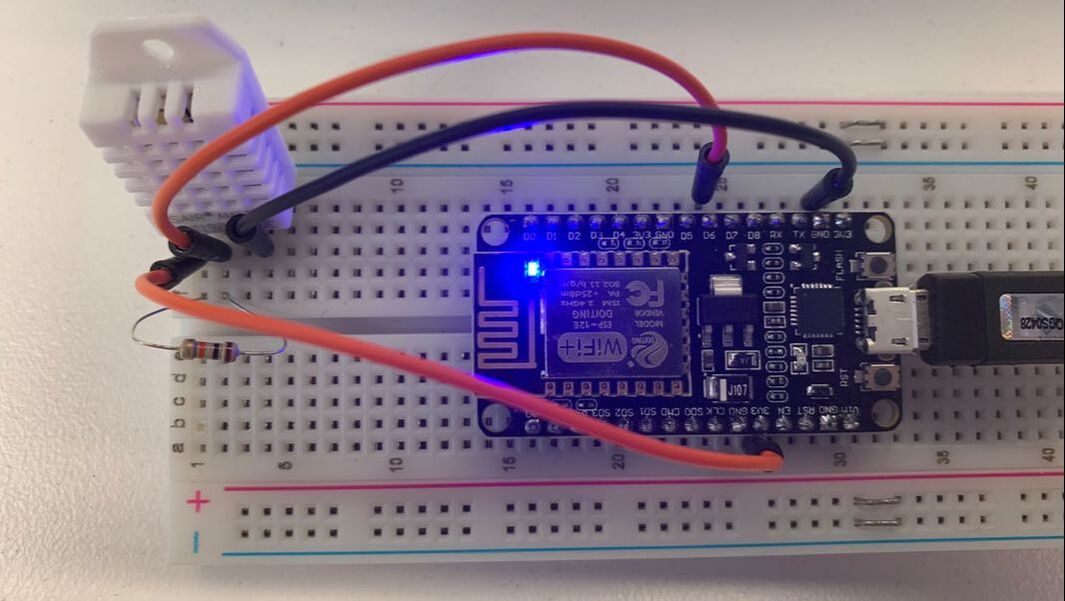 For the second week of the summer studio, our task was to set up an an IoT infrastructure for our IoT products. We are 8 people together in the studio, and we all agreed to form two teams based on similar IoT products. I grouped up with 3 team members, who are also working with the DHT11/22 sensor. We decided to spend half an hour researching individually in the group before getting together to set up a plan. After discussing and bouncing ideas of one another, we came up with the following format of using a MQTT broker, InfluxDB, NodeRed, and Graphana. Basically NodeRed does the conditioning, Influx DB stores the data, and Graphana displays the data. Next week, when we are working our individual sprints, I will go in to depth with the different programmes. As a first step to set up our infrastructure, we created the temperature sensor and programmed it in Visual Studio Code to send data to our MQTT broker. The code we ran was very simple allowing the DHT22 sensor to read the temperature and humidity in the room with a few seconds a part and publishing the data to our MQTT topic. We delegated our tasks, so Tim said sat up our MQTT broker on Vultr.com using this guide. Secondly, I sat up the InfluxDB database, Michaela sat up NodeRed, and Nick sat up Graphana. I sat up InfluxDB, which is an open-source time series database. The purpose behind this database is to have a virtual place for us to store and keep a record of all the data we generate via our IoT products. Based on this historical data, we will be able to perform analysis. InfluxDB can be installed on ubunto and typing the following commands: wget -qO- https://repos.influxdata.com/influxdb.key | sudo apt-key add - source /etc/lsb-release echo "deb https://repos.influxdata.com/${DISTRIB_ID,,} ${DISTRIB_CODENAME} stable" | sudo tee /etc/apt/sources.list.d/influxdb.list Here after, we install InfluxDB with this command: sudo apt-get update && sudo apt-get install influxdb sudo systemctl unmask influxdb.service sudo systemctl start influxdb The last step is to test, if Influx is working by entering Influx in the terminal. This should show it is connected to Influx CLI, as shown in the photo below. When it is connected, you can create a database using the command below. Sensordata is the name of our database. CREATE DATABASE sensordata 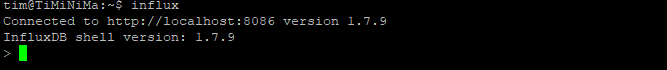 The next step is to install NodeRed, which is a flow-based development tool for visual programming. We used this guide to install it. The purpose behind NodeRed is that we can get data from our MQTT broker into InfluxDB. Our last step was to visualise our data using Graphana, an open source analytics and monitoring solution for databases. Ironically, our biggest struggle this week was our last step on how to use Graphana. The reason why we chose to visualise our data in this program is because our quick prior research showed that this programme is popular in demand, hence good community support. We used this tutorial from Grapahana to set up our visualisation. To run Graphana we ran our localhost in the browser, http://localhost:3000/. Afterwards, we added our data source as InfluxDB by typing our ip address and port number, this enabled us to start our dashboard, as you can see in below photo. We used the open query table in Graphana, writing SQL and had our data showing in two tables, as shown the picture, one with humidity and one with temperature. Additionally, we played around with the design of it, e.g. changed the colours of the graphs, the time span, and current value etc.. 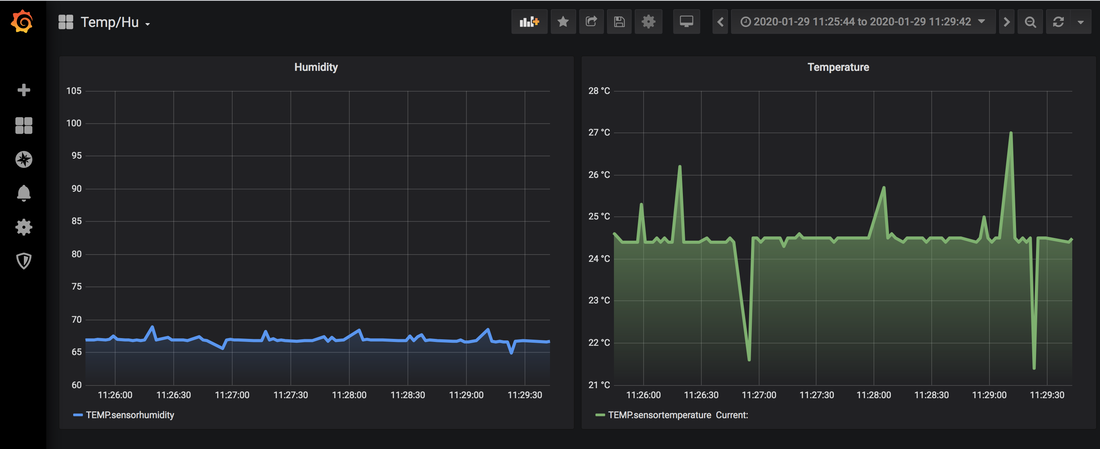
0 Comments
Leave a Reply. |
Malan ChristiansenMy weekly experience of UTS summer studio 2020: IoT Product Development from a Data Perspective. ArchivesCategories |
 RSS Feed
