Malan's summer studio 2020: IoT Product Development from a Data Perspective.
This blog is created to share my learning experience and showcase my portfolio over this 6 week summer studio. I will upload a post by the end of each week. Enjoy my blog!
|
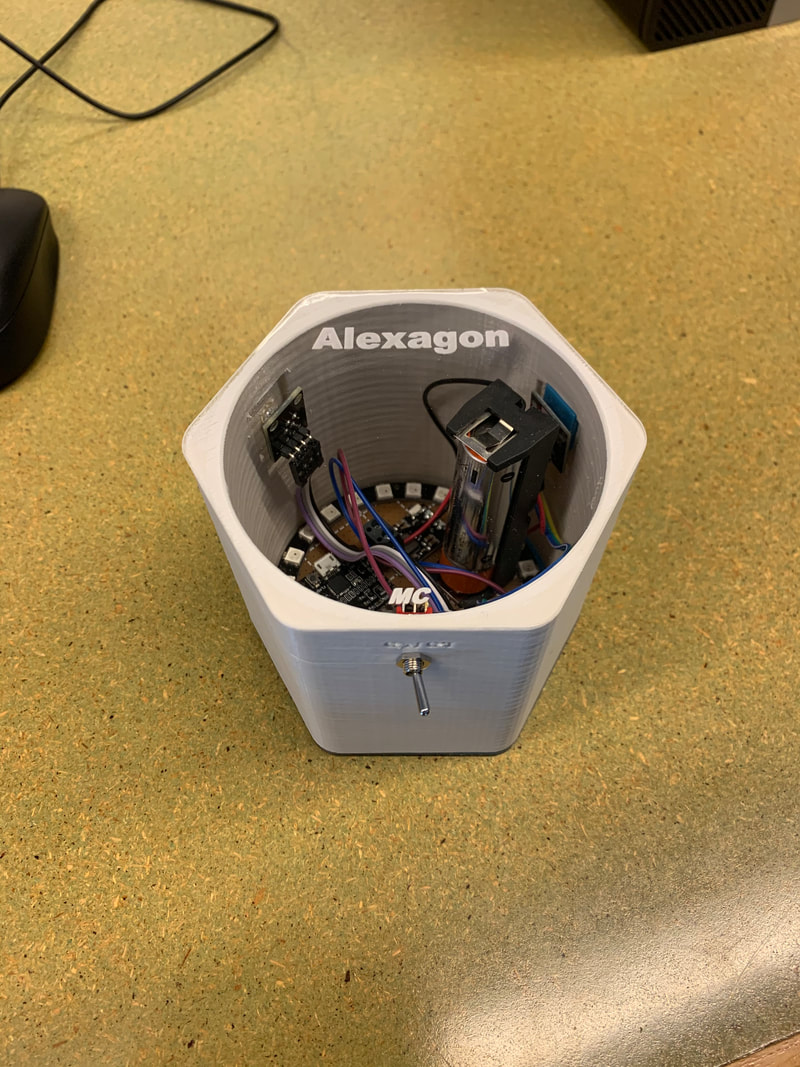
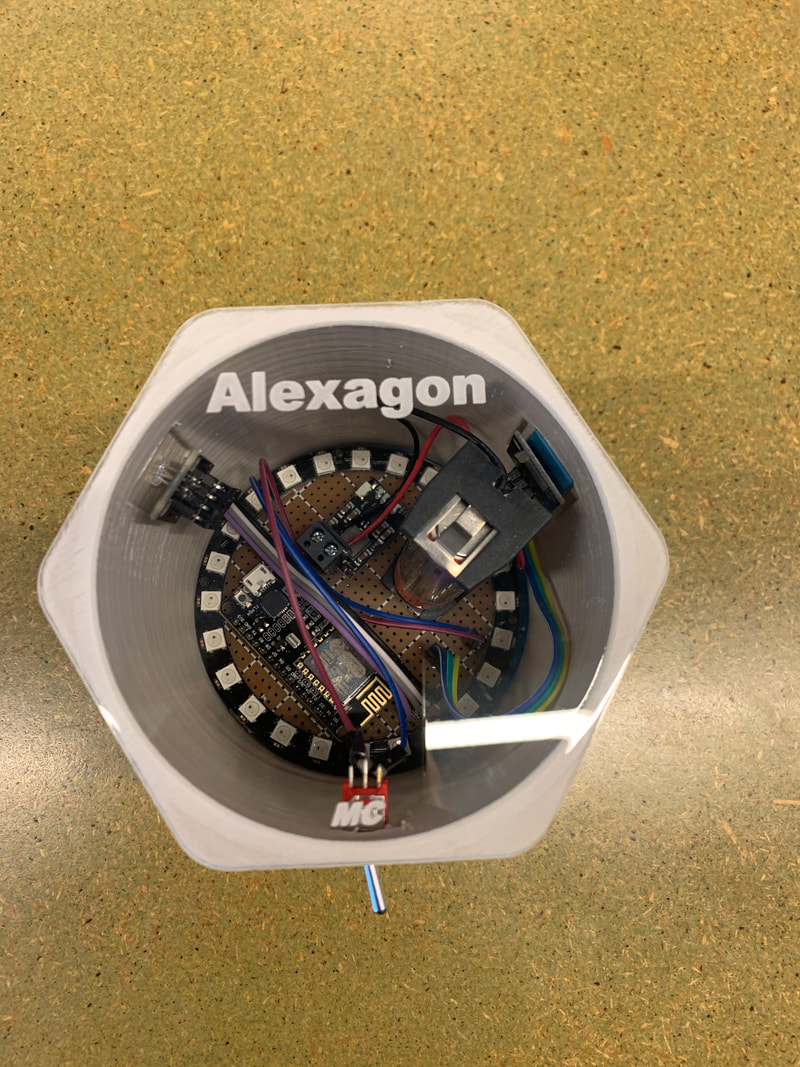
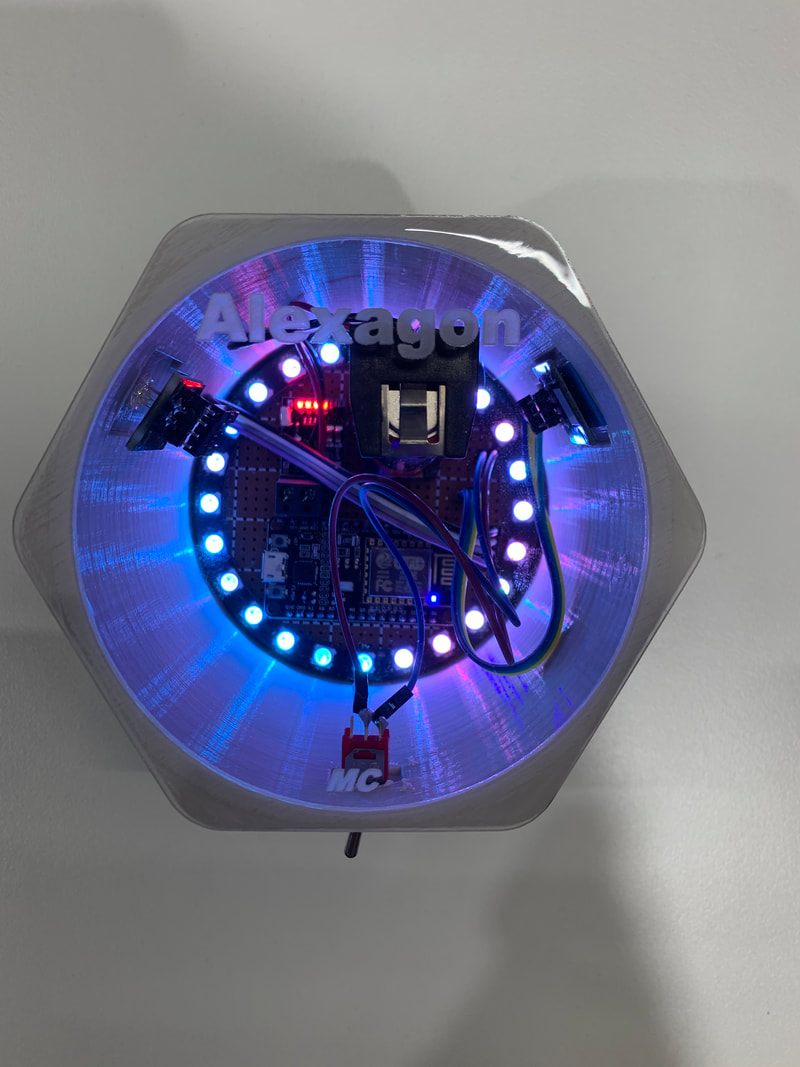
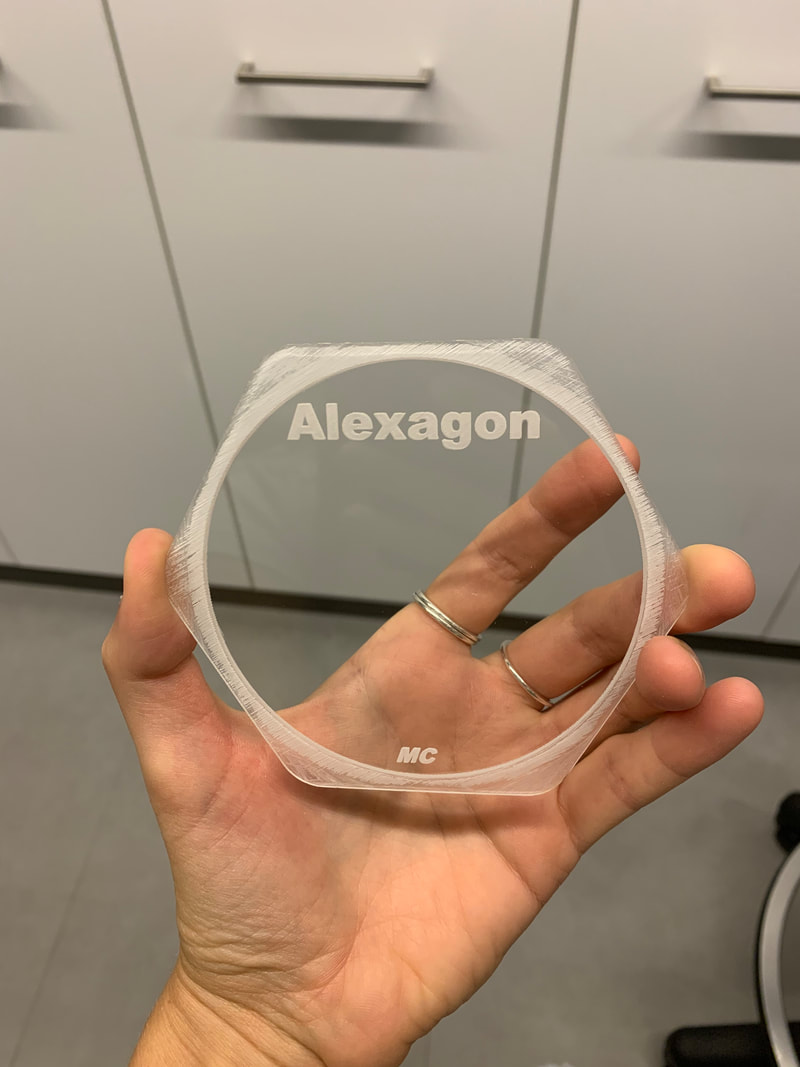
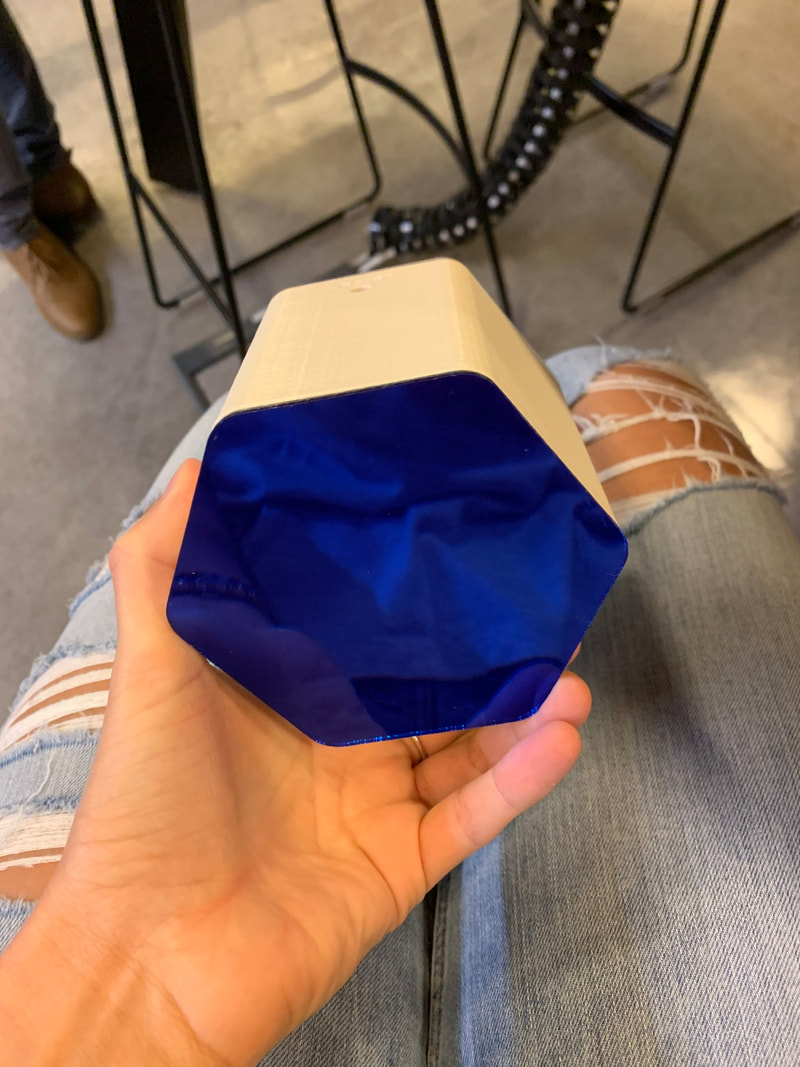
The final week ended yesterday and here is a photo of my final product, Alexagon! In the final week, I have made all the final adjustments and fixed minor details of my product. The 3D printer had made the design a little rough around the edges and therefore it needed to be filed correctly so it fitted properly with led the lid and bottom, when I put together the product.
Furthermore, I added new code into the existing code onto the node mcu for the new LED light circle, making every second light change from blue to red every other second. I used the code from here. Otherwise I kept the same code for using the DHT 11 sensor, only changing the digital pins, as I had moved to when I was wiring components together. We ended the week by showing off our products amongst other UTS students who have also participated in a summer course and built something different. The overall feedback from students was that they liked I had added LED lights and designed a Hexagon :-) My reflection on this course has ultimately been how cool it has been to built an IoT product from scratch not having prior knowledge on the topic. It's been a great learning curve dividing the weeks into sprints knowing what to focus on and being able to work autonomously and together as a team helping each other with our individual devices. Furthermore it has been exciting to learn new concepts of IT and to gain more practical experience in Python, Visual Studio Code, Fusion 360 and engineering in general of building and mechanical design. To be continued.
0 Comments
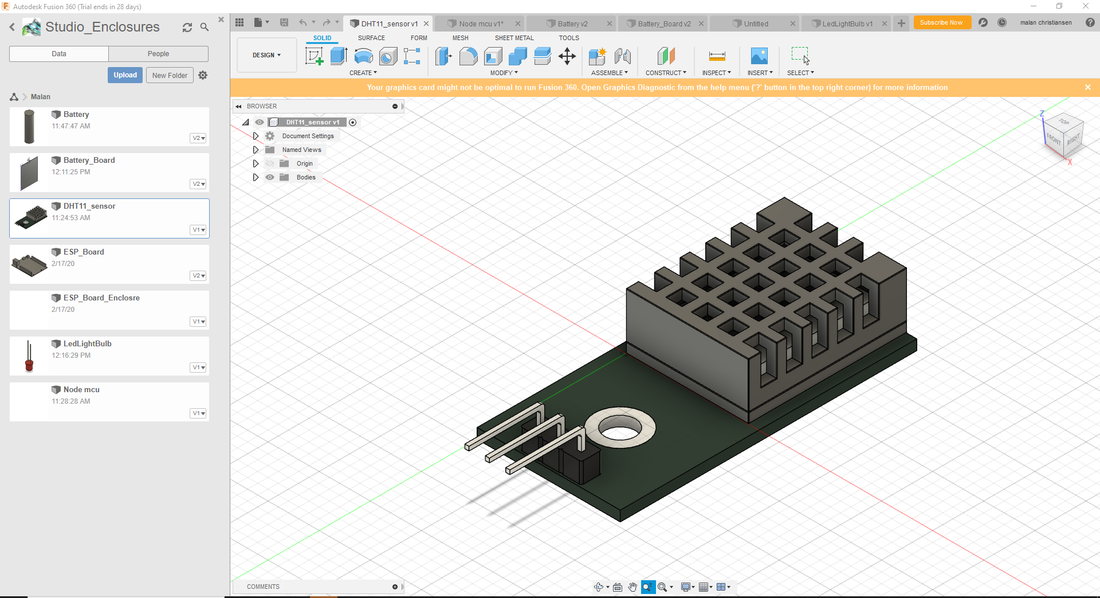
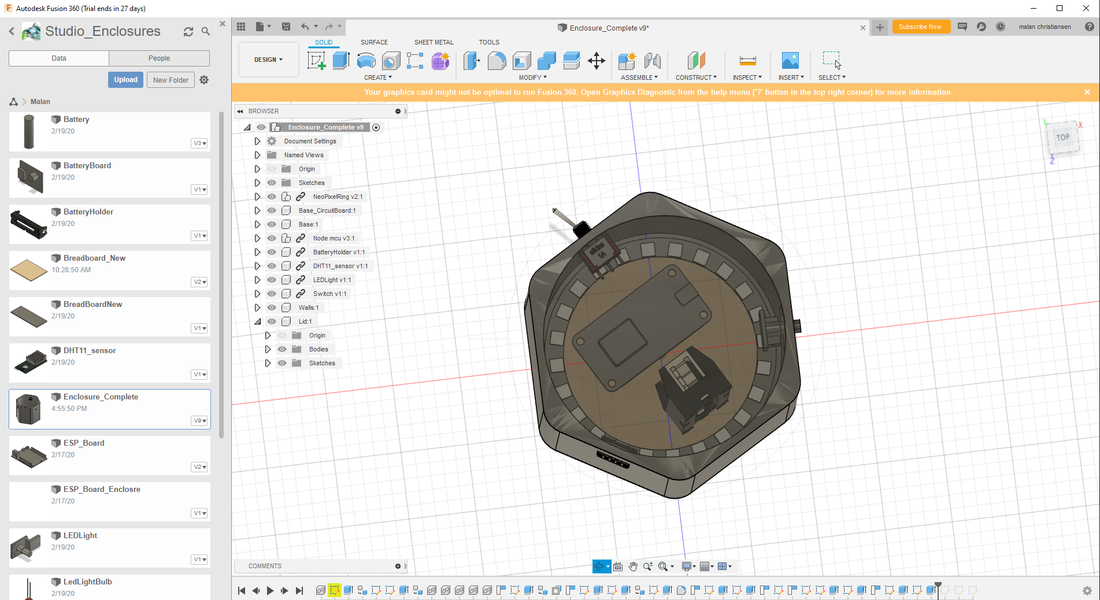 This week I have designed my final IoT product in Fusion 360. The photo above shows my final product ready for 3D printing! As you can see, I decided to design a hexagon with my temperature/humidity sensor on one side, my LED light on another side, and a switch to turn on and off on a third side! In the bottom, you can spot a round circle of LED lights, which I decided to add to my design, cause I thought it would look cool with a see through lid and transparent walls! I started out by measuring all my components to build my product and the build them separately in Fusion 360. My teammate Tim made me aware that some of the popular opponents can be found and downloaded directly into the program via grabcad.com. I therefore downloaded the DHT 11 and my battery holder. Otherwise, I build all the other components in the program. An example is below photo of the LED light versus the downloaded DHT 11. As you can see there is a bit differences in the details from the webside versus my own build component in Fusion 360. Furthermore we are able share each other's design, and I therefore used my other teammate Nick's node mcu, as he already designed this component. Additionally another team member from the other team used my build LED light :-)
After I had build and downloaded all the components I needed for my device, I started trying placing them together in Fusion 360 and playing around with designs. At first I wanted to make a cylinder but quickly found I wanted to design a hexagon instead, as I wanted flat walls to place the DHT11 sensor, switch and LED light. I decided to design the breadboard as a round circle in the bottom and place my node mcu, battery holder and wire connectors to the switch, led light and temperature sensor.
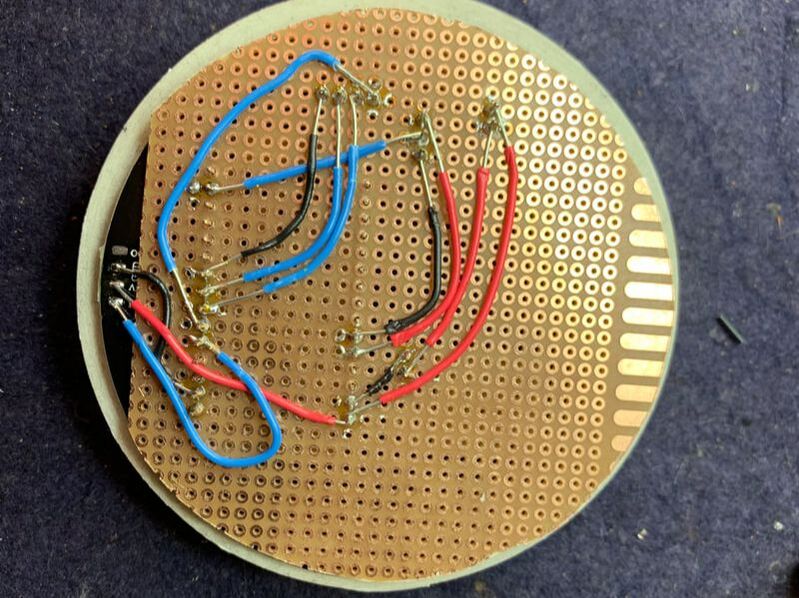
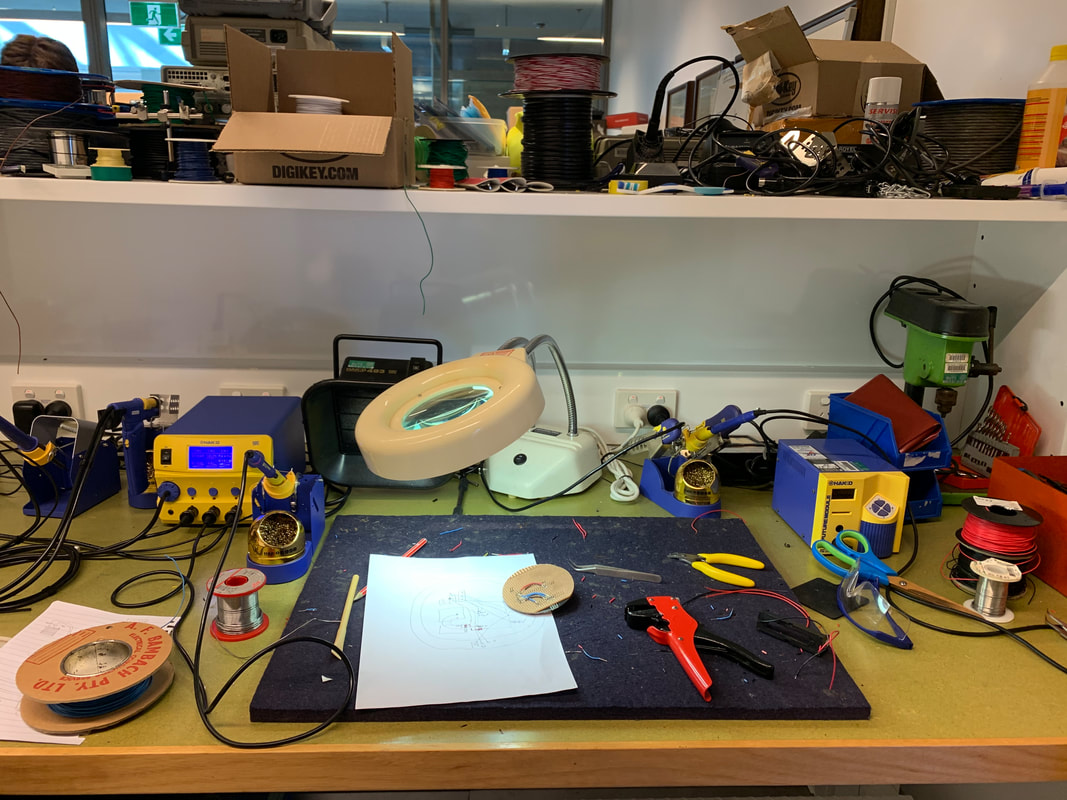
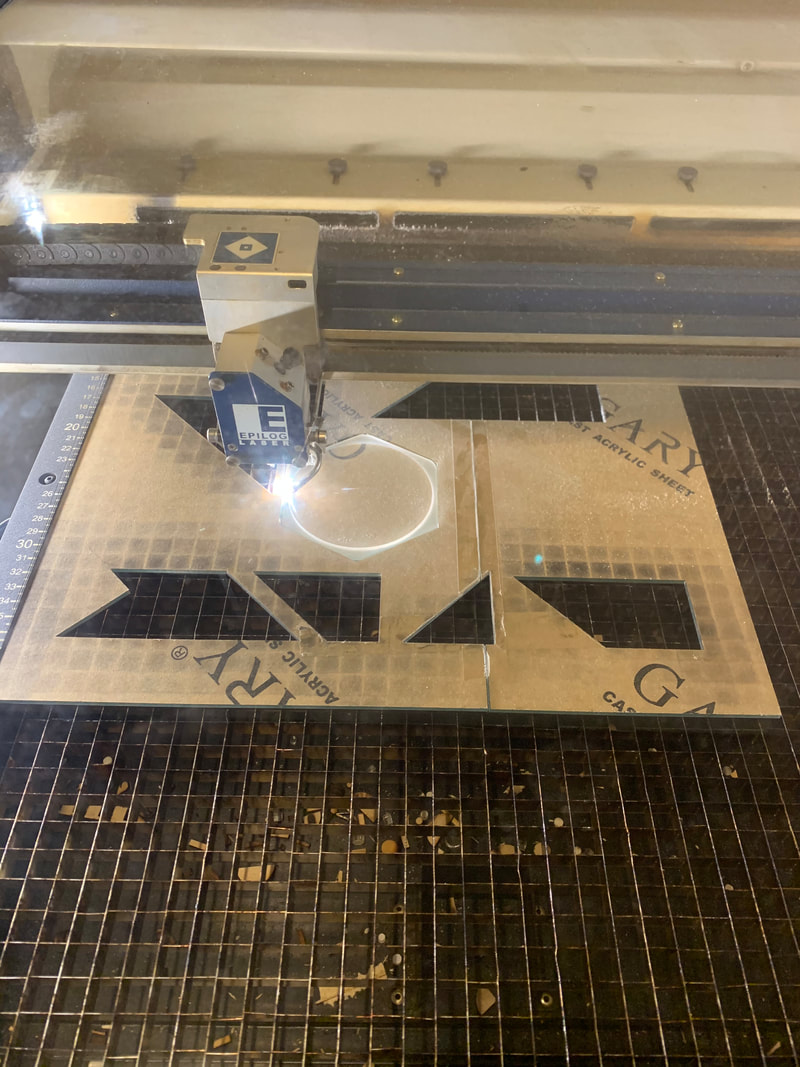
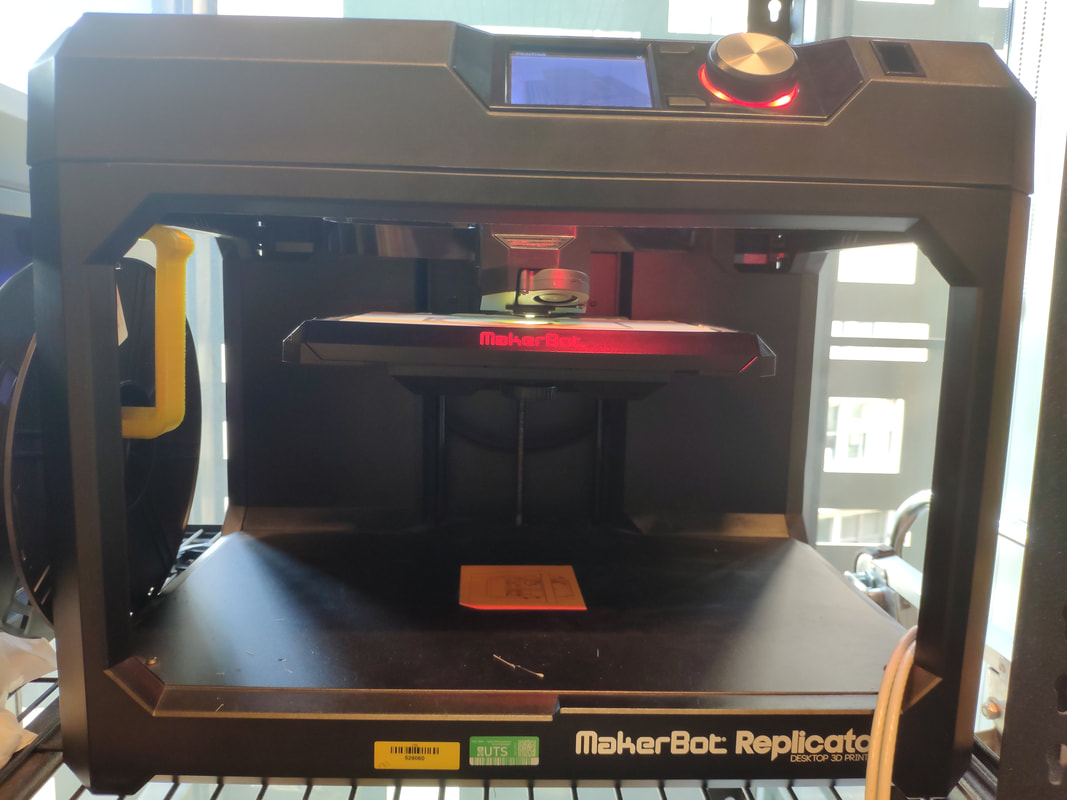
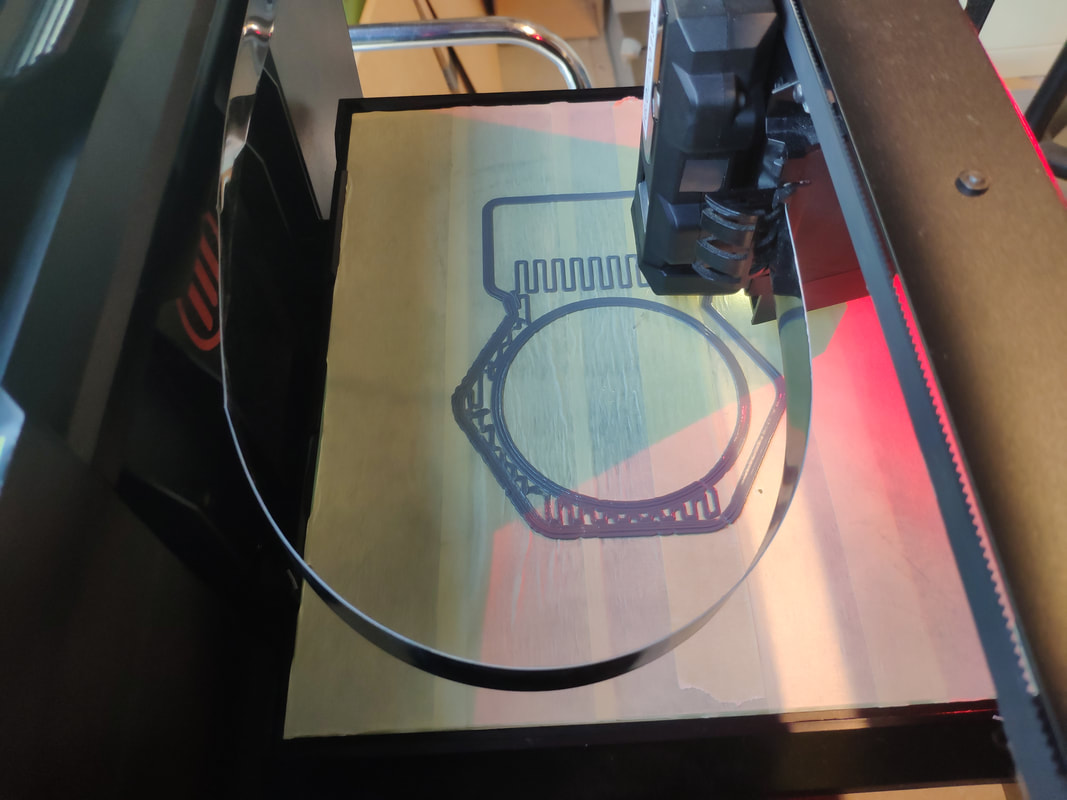
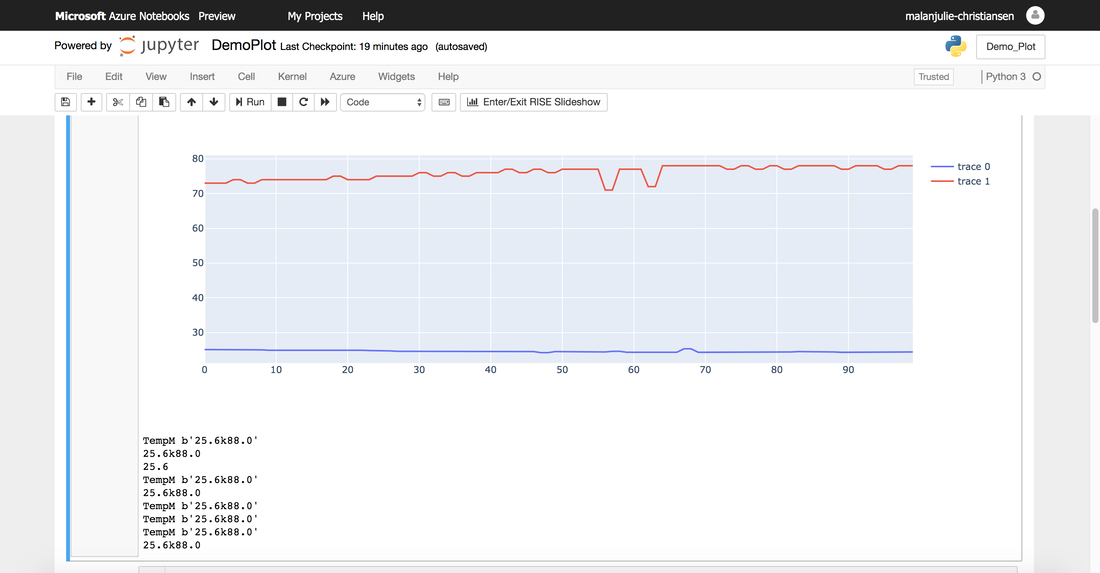
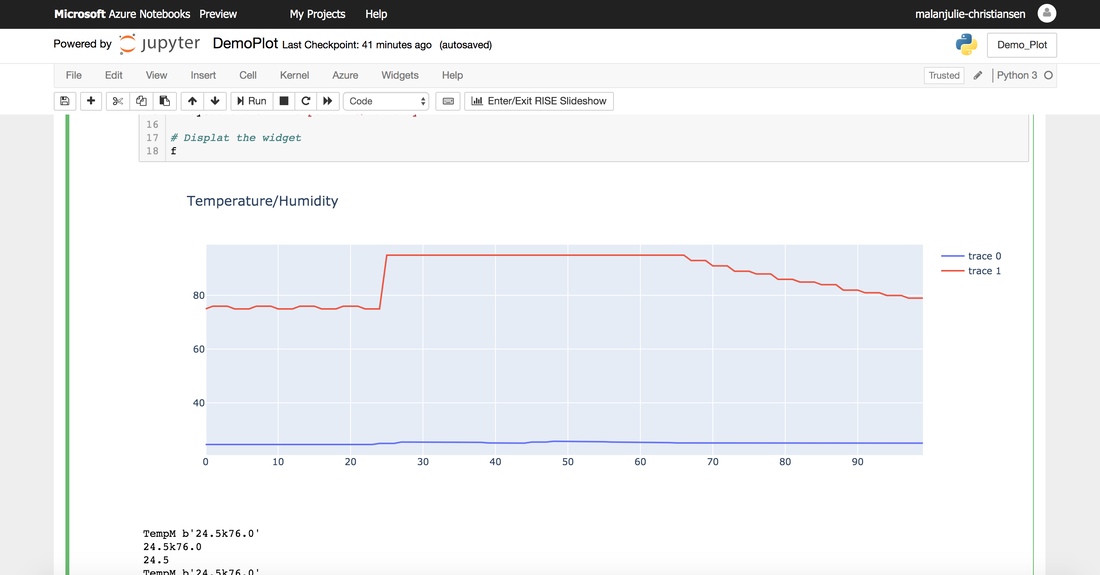
After having build and design my product in Fusion 360, it was time to build the product in real life. The photos above show the working process of wiring and soldering the node mcu to the breadbaord to make it fit to the round circle and my designed hexagon. Below are some photos of when my design was 3D printed and the bottom and lid was laser cut. In this week's sprint I have focused my efforts on the programming language Python, and how to plot my data using Plotly in Jupyter Notebook, as you can see in below photo. To run Jupyter Notebook, I used Microsoft Azure and to get started I installed paha-mqtt for connecting to my database and plotly to visualise my data in Jupyter Notebook: #!conda install "notebook>=5.3" "ipywidgets>=7.2" -y #!conda install plotly -y #!pip install paho-mqtt After this I ran these lines of code using these two guideline from plotly's website: Line charts in in Plotly and Plotly Figure Widget overview in Python. 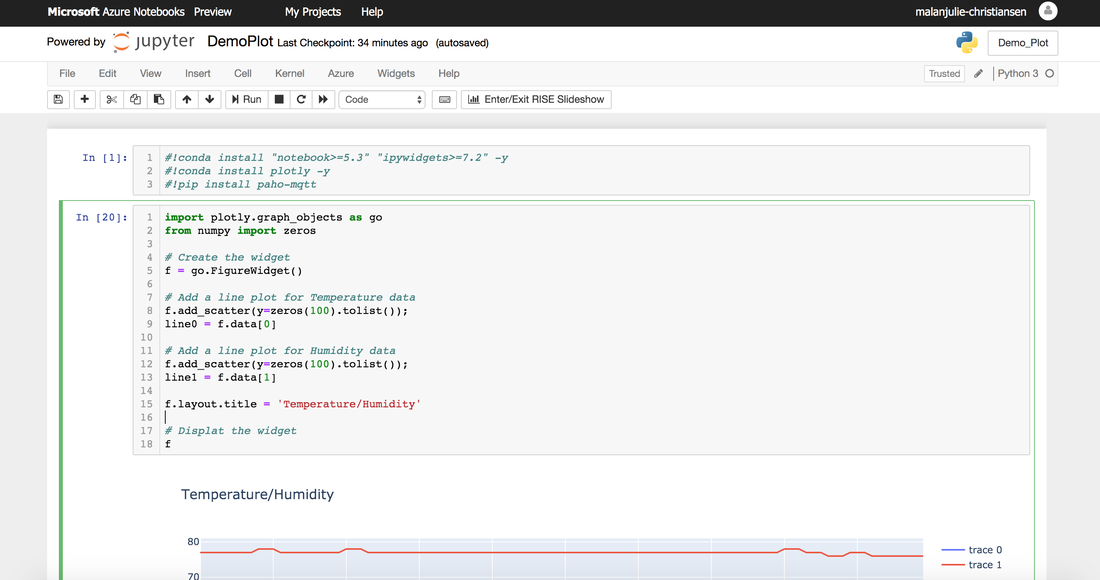 This line of code got the widget showing, but in order to connect the data from our mqtt broker, I had to subscribe to my database TempM, which I created in week 2. Furthemore, to get the graphs showing humidity and temperature, I had to split them as well, as I have also done in Visual Studio Code. As you can see in my code, line 0 is temperature and line 1 humidity. 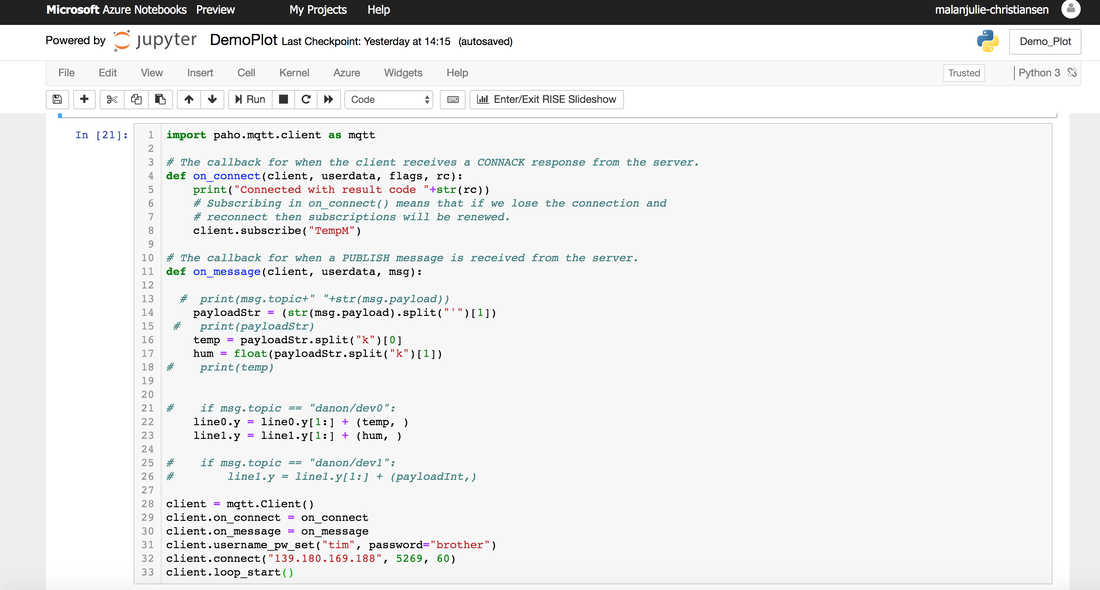 The result was these photo below. The second screenshot is when I blew on the sensor, and the graphs started fluctuating.
Additionally this week, I completed this 6.5 hours online course including lots of exercises to get more practical experience.  This week has given me a great learning experience, as I dived into working individually on my IoT product and working solo on the same sprint we did as a group in week 2 enabling me to better understand each step of the process. The IoT product that I have chosen to build is a temperature/humidity sensor, where I can visualise the data. I have also added a LED light that can be turned on and off, just because why not when you're playing with IoT. Additionally, I have added a rotation sensor to my device, so it can 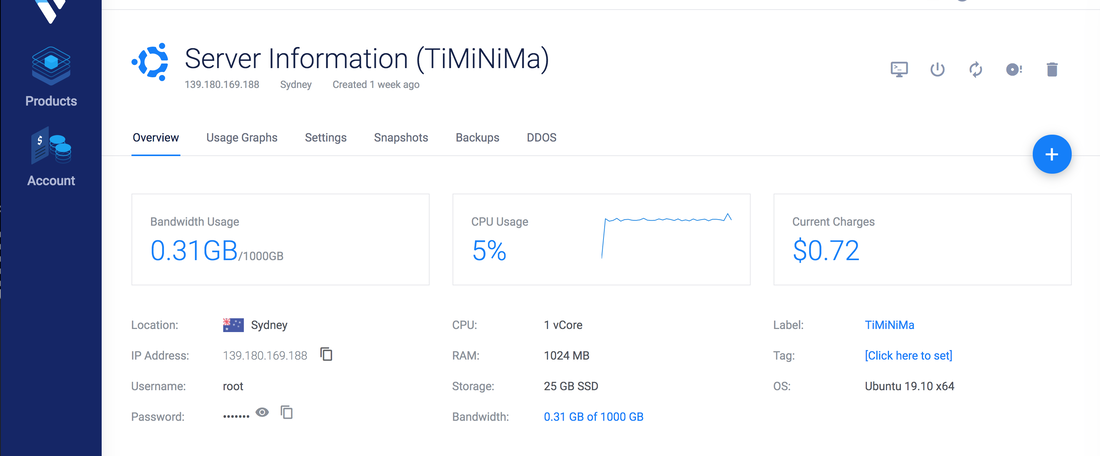 Last week as we built out infrastructure, we set up our shared MQTT broker on Vultr.com, which is the same broker I have used this week (see photo above). First of all, I started running the code in Visual Studio Code to get data from my temperature/humidity sensor, as you can see in the terminal in below photo. I used the library for the DHT11 sensor and divided it to show humidity and temperature separately. 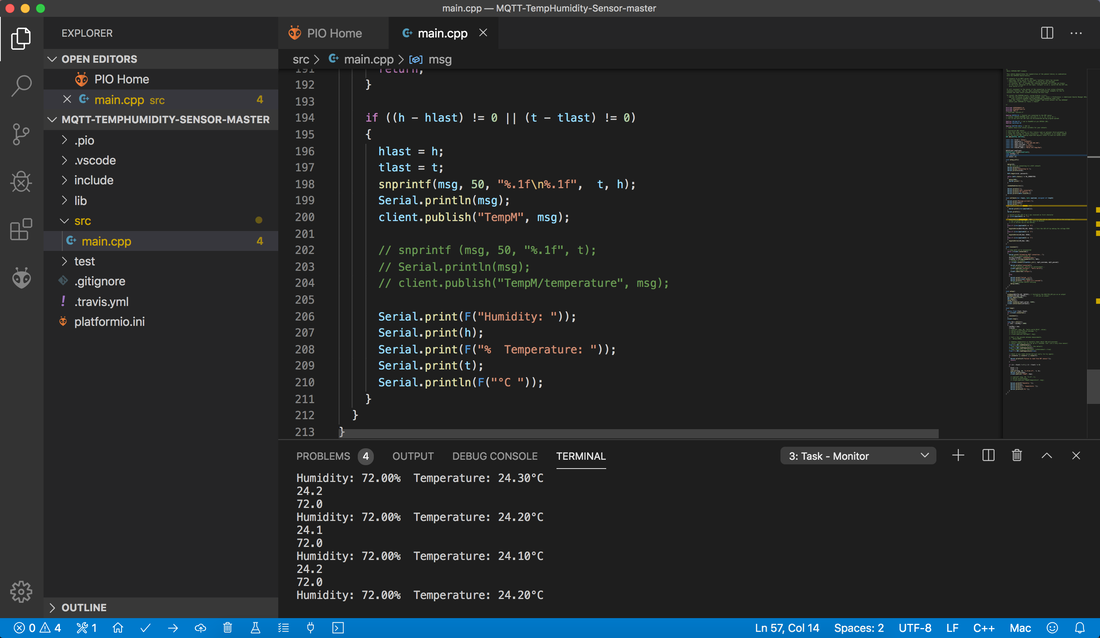 Next step was to store the data in the database we created in InfluxDB last week and do the conditioning in NodeRed to display my data from the device nicely in Graphana. As you can see in the photo below of NodeRed, I created my own table in our Database, TempM, and set that to display in Graphana. 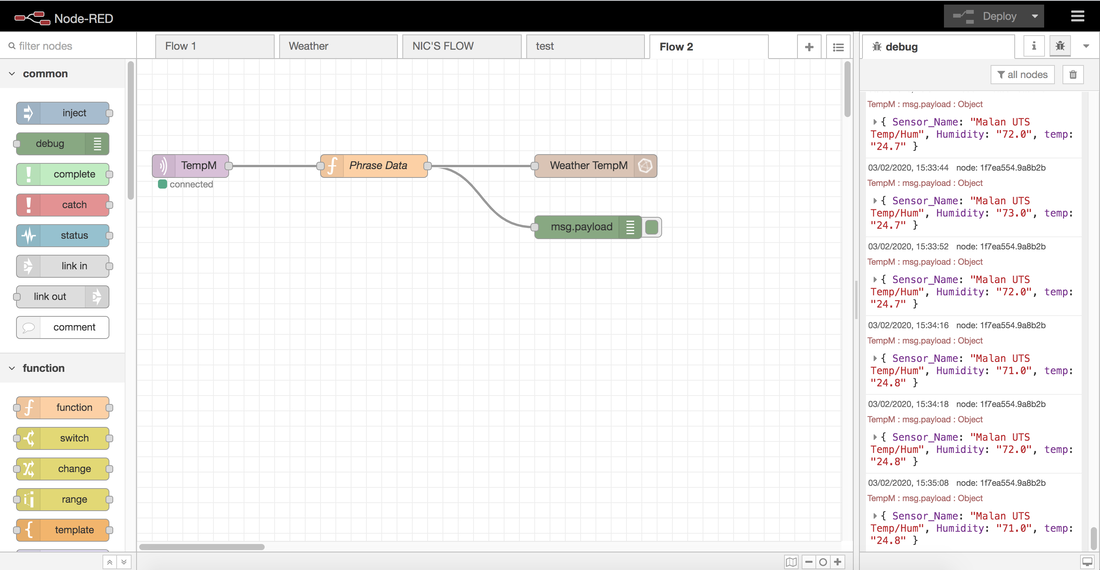 In Graphana, I created two tables for temperature and humidity each to display the data in different ways. I sat our datasource as our database and used the following query for the temperature tables: SELECT Temp FROM "TEMP".."TempM" . The first table shows the historical data over the given period of time and the second table shows the last added value, hence giving a quick overview of the current moment looking at the tables. 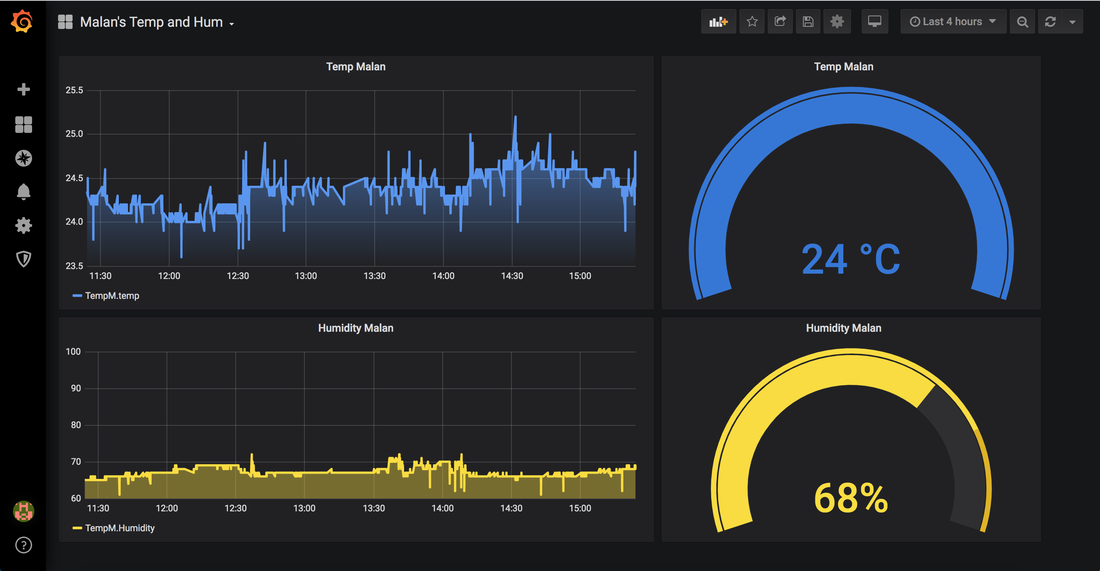 Additionally, my team member Michala made me aware of Chonohraph, which is a great visualisation tool for exploring InfluxDB instead of using Putty to check our databases (see photo below). 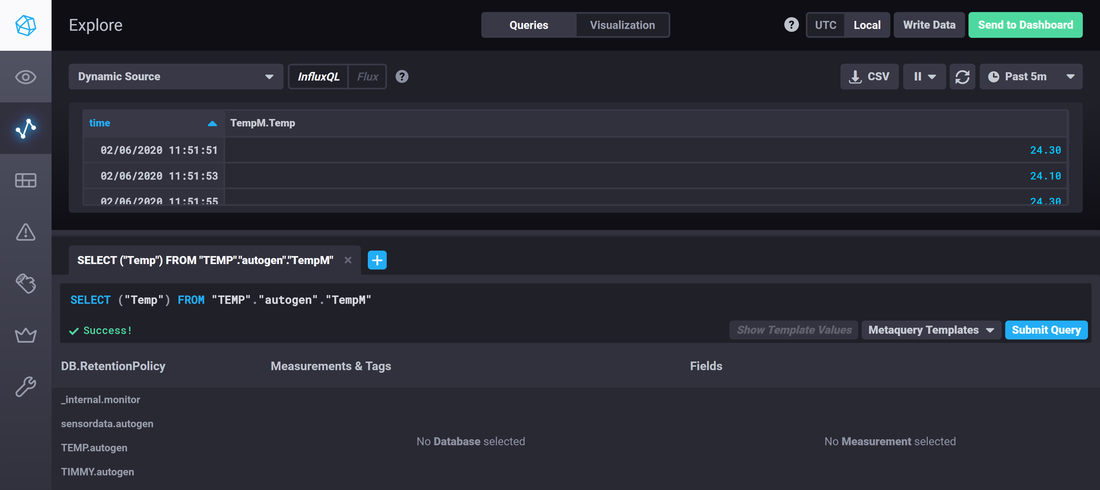 As mentioned in the beginning, I also decided to add on a LED light to my breadboard that can be turned on and off via terminal. After I had my sensor up and running, I therefore added the code for the LED light in Visual Studio Code and set the lamp to be on. Here after, I went into putty via my Vultr profile and used these 4 different command lines: mosquitto_pub -h 139.180.169.188 -u tim -P "password" -t inTopic -m "0" mosquitto_pub -h 139.180.169.188 -u tim -P "password" -t inTopic -m "1" mosquitto_pub -h 139.180.169.188 -u tim -P "password" -t inTopic -m "2" mosquitto_pub -h 139.180.169.188 -u tim -P "password" -t inTopic -m "3" This made the builtin LED light on the NodeMCU and the added LED light turn on and off! The photo below shows, when the lights are turned on :-) 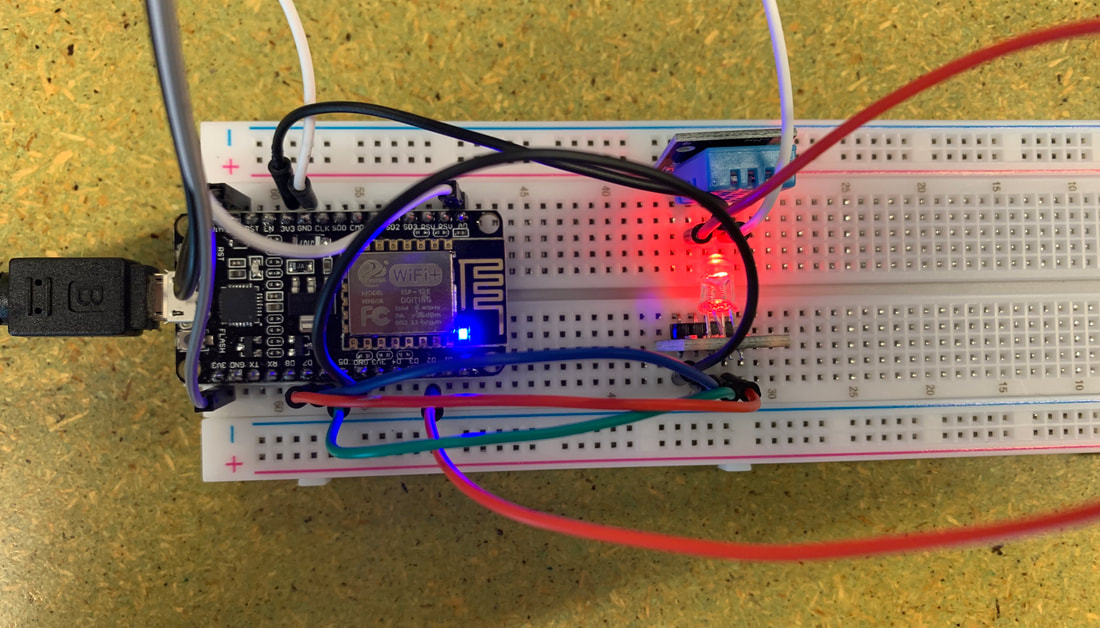 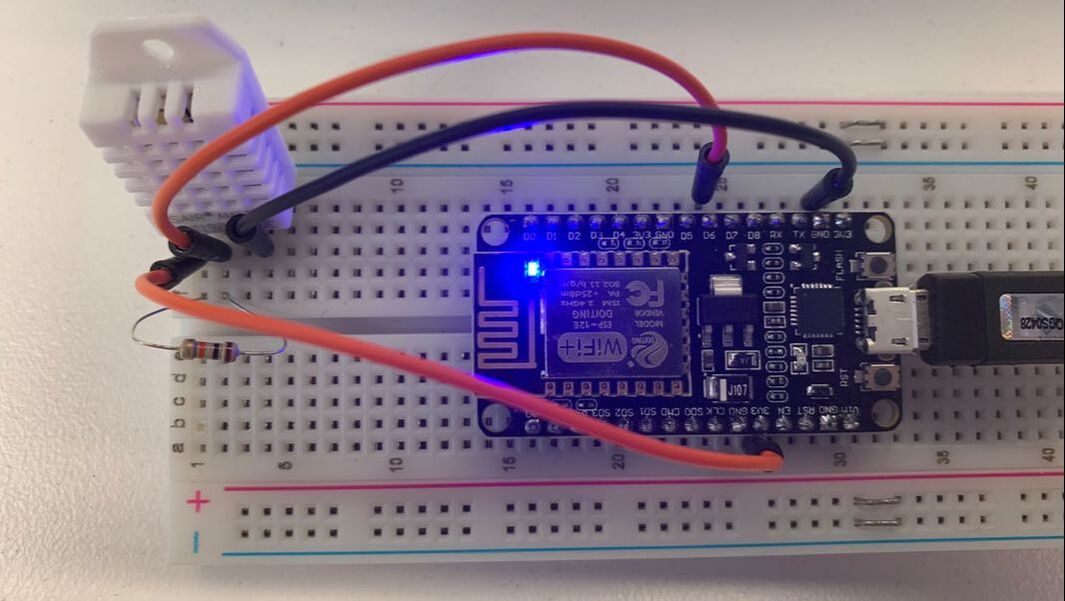 For the second week of the summer studio, our task was to set up an an IoT infrastructure for our IoT products. We are 8 people together in the studio, and we all agreed to form two teams based on similar IoT products. I grouped up with 3 team members, who are also working with the DHT11/22 sensor. We decided to spend half an hour researching individually in the group before getting together to set up a plan. After discussing and bouncing ideas of one another, we came up with the following format of using a MQTT broker, InfluxDB, NodeRed, and Graphana. Basically NodeRed does the conditioning, Influx DB stores the data, and Graphana displays the data. Next week, when we are working our individual sprints, I will go in to depth with the different programmes. As a first step to set up our infrastructure, we created the temperature sensor and programmed it in Visual Studio Code to send data to our MQTT broker. The code we ran was very simple allowing the DHT22 sensor to read the temperature and humidity in the room with a few seconds a part and publishing the data to our MQTT topic. We delegated our tasks, so Tim said sat up our MQTT broker on Vultr.com using this guide. Secondly, I sat up the InfluxDB database, Michaela sat up NodeRed, and Nick sat up Graphana. I sat up InfluxDB, which is an open-source time series database. The purpose behind this database is to have a virtual place for us to store and keep a record of all the data we generate via our IoT products. Based on this historical data, we will be able to perform analysis. InfluxDB can be installed on ubunto and typing the following commands: wget -qO- https://repos.influxdata.com/influxdb.key | sudo apt-key add - source /etc/lsb-release echo "deb https://repos.influxdata.com/${DISTRIB_ID,,} ${DISTRIB_CODENAME} stable" | sudo tee /etc/apt/sources.list.d/influxdb.list Here after, we install InfluxDB with this command: sudo apt-get update && sudo apt-get install influxdb sudo systemctl unmask influxdb.service sudo systemctl start influxdb The last step is to test, if Influx is working by entering Influx in the terminal. This should show it is connected to Influx CLI, as shown in the photo below. When it is connected, you can create a database using the command below. Sensordata is the name of our database. CREATE DATABASE sensordata 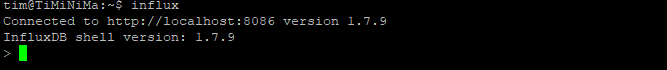 The next step is to install NodeRed, which is a flow-based development tool for visual programming. We used this guide to install it. The purpose behind NodeRed is that we can get data from our MQTT broker into InfluxDB. Our last step was to visualise our data using Graphana, an open source analytics and monitoring solution for databases. Ironically, our biggest struggle this week was our last step on how to use Graphana. The reason why we chose to visualise our data in this program is because our quick prior research showed that this programme is popular in demand, hence good community support. We used this tutorial from Grapahana to set up our visualisation. To run Graphana we ran our localhost in the browser, http://localhost:3000/. Afterwards, we added our data source as InfluxDB by typing our ip address and port number, this enabled us to start our dashboard, as you can see in below photo. We used the open query table in Graphana, writing SQL and had our data showing in two tables, as shown the picture, one with humidity and one with temperature. Additionally, we played around with the design of it, e.g. changed the colours of the graphs, the time span, and current value etc.. 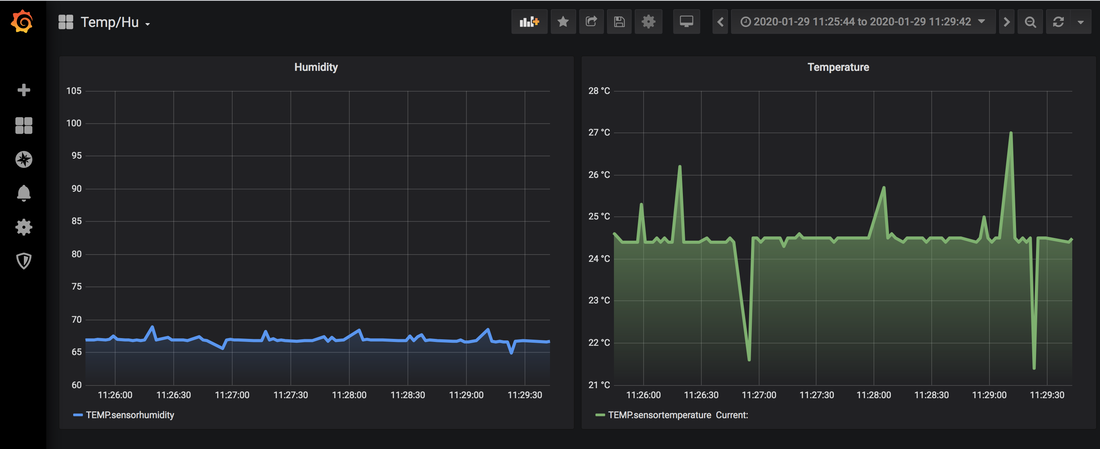 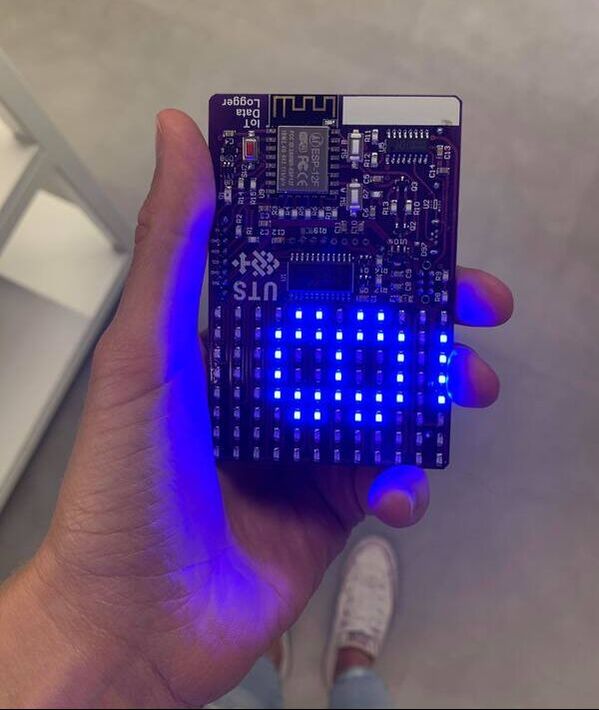 My first week of the summer studio has been all about learning the concept of internet of things (IoT) and starting to build small IoT circuits. On the first day, I built my very own IoT Data Logger, which is shown in the photo above. Each of us on the team constructed our own device by applying solder paste across the printed circuit boards (PCB) and identifying designators and placing all the surface mount components on the PCB, followed by a thorough inspection of correct placement and soldering the components on the top layer.
When we finished constructing the Data Logger, we downloaded software into the microcontroller, which enables it to be a data logger. From here, we set it up, so our Data Logger is individually connected and controlled by the app, Blynk. Here I add different features, such as the blue LED lights displaying my name etc. This leads me to tell about the following two days, where I played around with building small IoT circuits. This started out as quit a challenge, as I have no prior background knowledge in building IoT products or programming in Arduino to process data. However, by the end of day 3, I learned to build a small circuit (incl. LED Light and temperature censor) programming in Visual Studio Code, and controlling it via the Blynk app! :-) |
Malan ChristiansenMy weekly experience of UTS summer studio 2020: IoT Product Development from a Data Perspective. ArchivesCategories |


 RSS Feed
